Top Stocks
Ranked by the Openbook Reward score — highest first.
Stocks & ETFsFree to start · No card required · For information only. Not investment advice. Capital at risk.
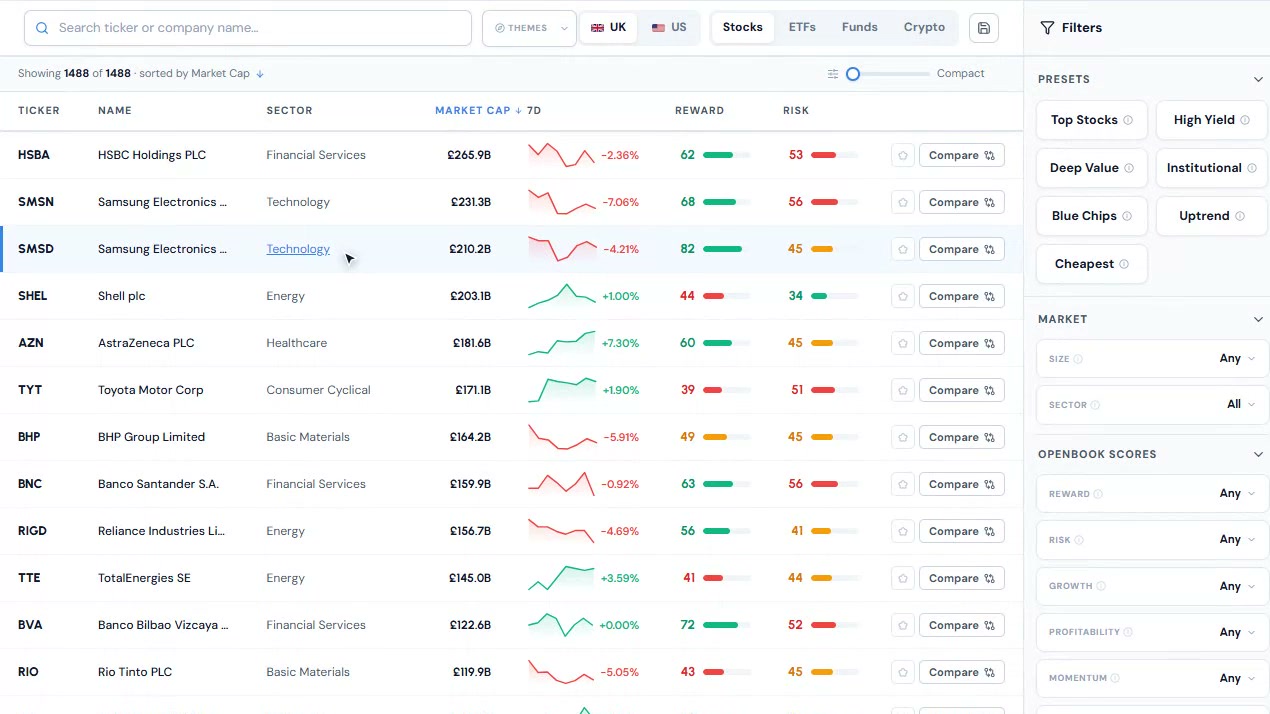
Seven saved screens translate a common objective into a consistent set of filters. Apply one, see exactly which filters it set, then change them.
Ranked by the Openbook Reward score — highest first.
Stocks & ETFsTop dividend payers, on a yield of 4% or better.
Stocks & ETFsCheap on both P/E and P/B at the same time.
Stocks onlyLarge, established companies with lower modelled risk.
Stocks onlyPlus Institutional (heavily owned by institutions), Uptrend (50-day average above the 200-day) and Cheapest (lowest P/E first).
The Reward score is a weighted blend of four factors, and you can screen on each of them directly — the same numbers that explain the company on its own research page.
Revenue, net income and free-cash-flow CAGRs, forward estimates, and analyst price targets.
One-year and six-month returns against the benchmark, three-month absolute return, and volume trend.
Gross and net margin against the sector, cash conversion, operating profit growth, ROE and ROA.
Forward P/E, PEG, EV/EBITDA, P/FCF and EV/revenue, adjusted for net debt and accruals.
Line up to four stocks in one table — Reward, Risk, the factors behind them and the fundamentals, row by row. Every company is scored the same way, so the numbers mean the same thing across the table. Save the ones worth a closer look and open any of them without losing your place.
Or start from a ready-made comparison:
UK banksHSBC, Barclays, Lloyds, NatWest Oil & miningShell, BP, Rio Tinto, Glencore Consumer brandsUnilever, Diageo, Tesco, BAT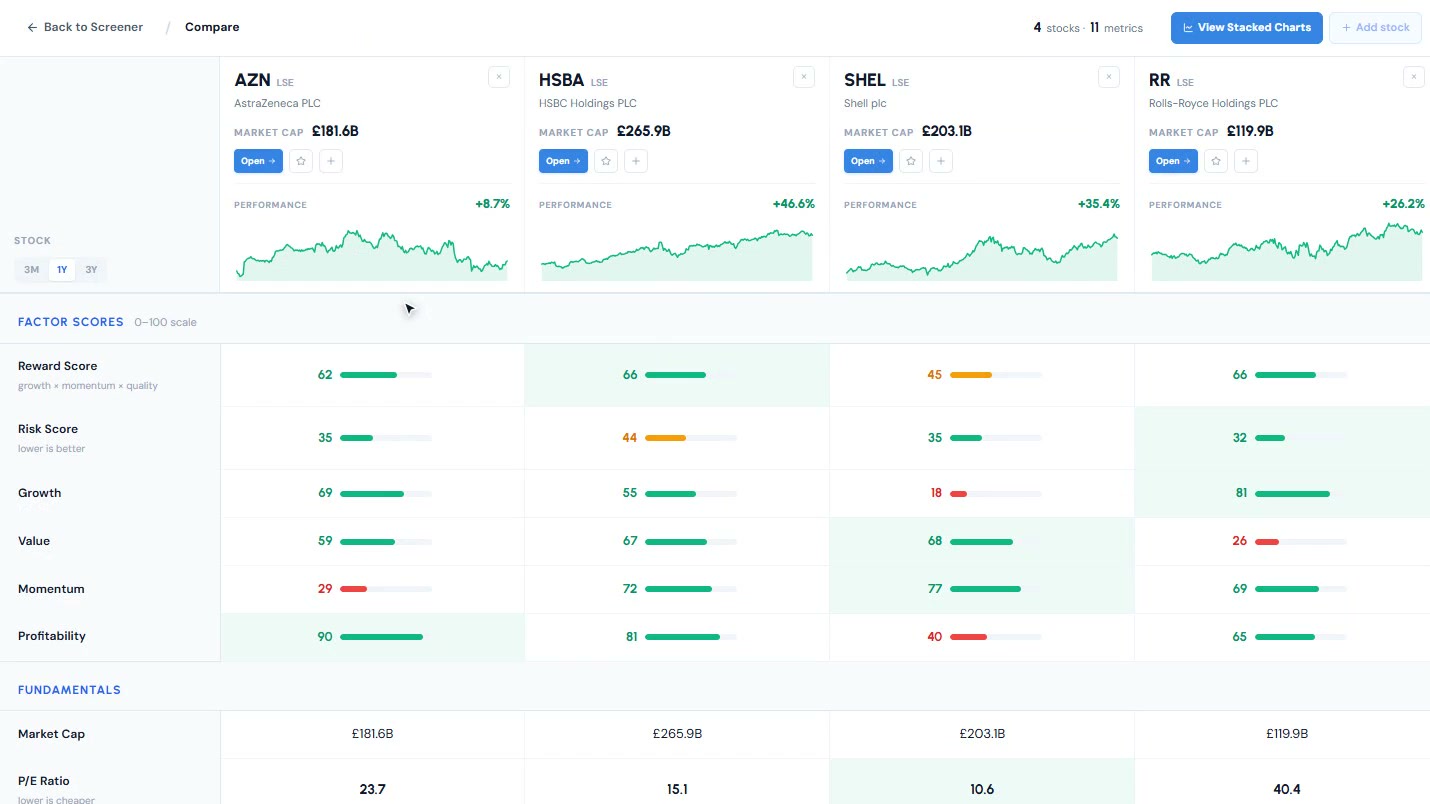
Know exactly what you are looking for? Switch on the metrics behind the score and filter the UK and US market by the precise drivers that fit your strategy.
Try the advanced filtersDiscover keeps ready-made collections of companies that share a trait, rebuilt from live data. Open one and every name in it is already scored.
Datacentre accelerators, semi-cap and AI compute.
Launch, satellites and the space economy.
Pure-play quantum computing developers.
Drug developers from clinical to commercial.
Both London- and US-listed companies. Full Reward and Risk scores currently cover 1,488 UK-listed and 6,325 US-listed companies with enough reporting history. US score coverage is still expanding, and where a company has insufficient data we show a blank rather than an estimate.
Yes. The screener also covers ETFs and funds, each with filters that suit them — category, AUM and 3M/1Y/3Y returns for ETFs; asset class, region, share class and a 1–7 risk level for funds. London-listed ETFs carry their own Reward and Risk ratings, built from performance, cost, income and diversification rather than the company factor model. Funds carry a risk level but no Reward score. Bitcoin and Ethereum are also listed, without scores.
Reward and Risk; the four Reward factors (Growth, Momentum, Profitability and Value); valuation metrics including P/E, forward P/E, PEG, P/S, P/B and EV/EBITDA; margins and returns (net and operating margin, ROE, ROA); dividend yield; institutional and insider ownership; beta; and company sector and size band. Which of these you can use depends on your plan.
Each applies a ready-made combination of filters: Top Stocks ranks by Reward, High Yield finds dividend payers at 4% or better, Deep Value looks for companies cheap on both P/E and P/B, Institutional favours heavy institutional ownership, Blue Chips prefers large and lower-risk companies, Uptrend takes a 50-day average above the 200-day, and Cheapest sorts by lowest P/E. You can adjust the filters afterwards.
Yes, and no card is needed. Ticker, company, sector, size, market cap, search and the compare tool are open to everyone. Creating a free account unlocks the Reward and Risk scores and lets you save one screen. Pro adds the individual factor scores, dividend yield and P/E as filters, the ready-made screens, and unlimited saved screens. See the pricing page for the current comparison.
No. Scores and screens are research tools, not personal recommendations. A screen helps you decide what to investigate further, not what to buy or sell. For information only. Not investment advice. Capital at risk.
Build your first UK or US screen with Openbook. Free to start, no card required.